Of over 3000 men participating in the Caerphilly study, there is follow-up data available
on 2010 subjects. Two groups were formed from this cohort:
- The 347 men who are in the top 20% of the diastolic distribution at either
phase II or phase III, and in the top 40% at the other phase
- The 284 men who are in the bottom 20% of the diastolic distribution at
either phase II or phase III, and in the bottom 40% at the other phase.
Additionally, these men are not on any antihypertensive drug at either phase
II or phase III.
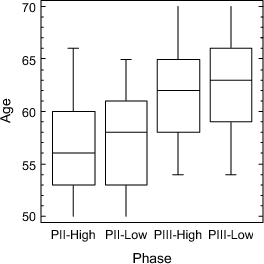
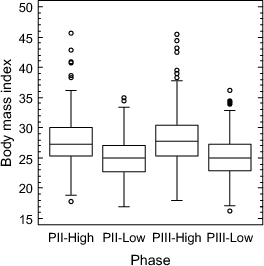
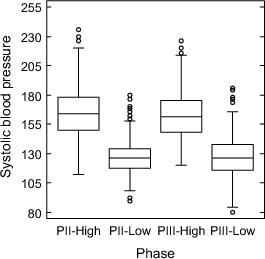
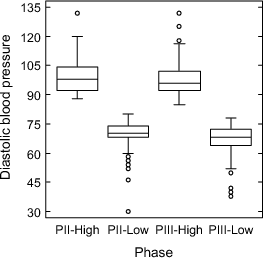
Phase II data was collected 1983–1985, phase III data in the years 1989–1991
(demographic data are summarised in Table 4.1). Evolution of age, BMI, diastolic and
systolic blood pressure are visualised in Figure 4.4. Aside from blood pressure
measurements and body mass index, the two quintiles did not show any significant
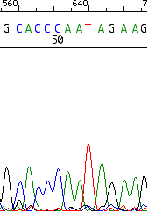
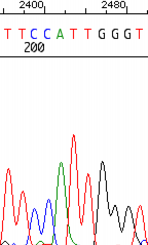
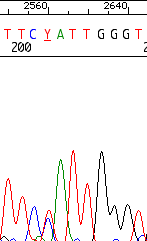
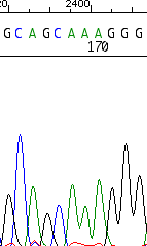
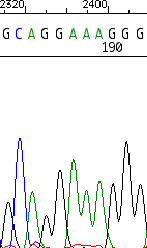
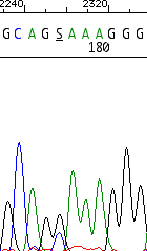
differences in both phases. Genomic DNA from these subjects was genotyped for the
presence of the Gly16Arg, Glu27Gln as well as the 5’-LC alleles using direct
sequencing of both strands (for protocol details see section 4.2.2). Genotyping of
the β2 adrenergic receptor variant was cross-checked by a second individual
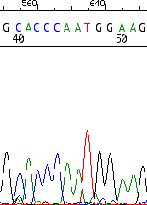
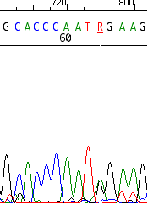
also unaware of the subject’s phenotype. For a representative example of Dye
Primer sequencing, see Figure 4.5. Dye Terminator sequencing examples are
shown in Figure 4.6 for the Arg/Gly16 variant and Figure 4.7 for the Glu/Gln27
variant.
The distribution of β2 adrenoceptor alleles did confirm to Hardy-Weinberg
equilibrium in this study. There was marked disequilibrium in the distribution of the
Glu27→Gln alleles between the top and bottom 20% groups (χ2= 5.5, p=.021), with the
frequency of the Gln27 allele markedly increased in the hypertensive subjects.
There was no difference in allele frequencies for the Arg16→Gly variant (Table
4.9).
|
|
|
|
| | Group | Gln27 | Glu27 | Arg16 | Gly16 |
|
|
|
|
| | Top 20% | 499 (72) | 193 (28) | 320 (46) | 372 (54) |
| Bottom 20% | 359 (66) | 187 (34) | 247 (45) | 299 (55) |
|
|
|
|
| | | χ2=5.5, p=.021 | n.s.
| | |
| Table 4.9: | Distribution, expressed as n (%), of the Glu27Gln and Arg16Gly
alleles of the human β2 adrenoceptor in Caerphilly exhibiting a marked
disequilibrium of the Gln27 variant |
|
The mutations at positions 1217 (5’-LC Cys/Arg19), 1244 (C1244T) and
1342 (Glu/Gln27) were found to be in strong linkage disequilibrium (χ2 =
903.8, p<0.0001), leading to three different main haplotypes (Table 4.10).
Haplotype frequencies were estimated by maximum likelihood estimation,
using the best state of haplotype composition, under assumption of equal prior
probabilities, as starting point for the expectation maximisation (EM) algorithm. In
order to get an impression of the significance of the estimated frequencies, a
bootstrap algorith was used, simulating the sample data on the basis of the
estimated frequencies and re-estimating them for 100 times, calculating mean and
variance.
|
|
|
|
|
|
| | Haplotype | Frequency | Variance | S.D. |
|
|
|
|
|
|
| | 5’ LC Arg19 | 1242C | Gly16 | Glu27 | 0.2945 | 0.0002 | 0.0151 |
| 5’ LC Cys19 | 1242T | Arg16 | Gln27 | 0.4538 | 0.0002 | 0.0151 |
| 5’ LC Cys19 | 1242T | Gly16 | Gln27 | 0.2374 | 0.0001 | 0.0110 |
|
|
|
|
|
|
| | Likelihood = 1136.95 | | | |
| |
| Table 4.10: | Haplotype frequency estimation for the human β2 adrenergic
receptor gene via the Best State method (632 subjects) |
|
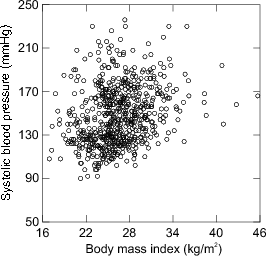
Figure 4.8 shows the correlation between both, systolic and diastolic, blood
pressure and BMI. As age and BMI are known predictors of blood pressure, we
performed multiple regression analyses on systolic and diastolic blood pressure as
dependent variables (Table 4.11) in both phases of the Caerphilly data set. All
available quantitative and qualitative factors were entered in the analysis to
investigate their possible influence on blood pressure. BMI (p < 0.0005), age (p <
0.0005), alcohol consumption (p<0.006) and the Gln27Gln polymorphism
(p<0.0005) remained as significant variables in the model for systolic blood pressure
whereas BMI (p < 0.0005), family history of heart attack in first degree relative
before 55yrs (p=0.020), smoking (p=0.026) and the Gln27Glu polymorphism
(p=0.079) remained as explanatory variables in the diastolic blood pressure model.
These effects matched with multiple regression analysis for pulse pressure as
dependent variable, resulting in age (p<0.0005), the Gln27Gln polymorphism
(p<0.0005), alcohol consumption (p<0.001), family history of heart attack in first
degree relative before 55yrs (p=0.027) and BMI (p=0.091) as independent
variables.
|
|
|
|
|
|
| | Effect | Coefficient | Std. Error | Std. Coef. | df | F | P |
|
|
|
|
|
|
| | Constant | | | | | | |
| BMI | 1.995 | 0.263 | 0.287 | 1 | 57.381 | 0.000 |
| Age | 1.015 | 0.209 | 0.184 | 1 | 23.524 | 0.000 |
| Gln27Glu | -5.400 | 1.524 | -0.133 | 1 | 12.552 | 0.000 |
| Alcohol cons. | 0.015 | 0.005 | 0.105 | 1 | 7.723 | 0.006 |
|
|
|
|
|
|
| | R2=0.155
| |
| Table 4.11: | Multiple regression analysis on the Caerphilly phase II data set for
systolic blood pressure as dependent variable. The Gln27Glu variant was coded
as 1 (Gln27), 2 (Gln27Glu), and 3 (Glu27). |
|
|
|
|
|
|
|
| | Effect | Coefficient | Std. Error | Std. Coef. | df | F | P |
|
|
|
|
|
|
| | Constant | | | | | | |
| Fam. History 55 | 4.710 | 2.011 | 0.086 | 1 | 5.484 | 0.020 |
| BMI | 1.624 | 0.152 | 0.397 | 1 | 113.796 | 0.000 |
| Smoking | -0.500 | 0.224 | -0.083 | 1 | 4.975 | 0.026 |
| Gln27Glu | -1.548 | 0.879 | -0.065 | 1 | 3.098 | 0.079 |
|
|
|
|
|
|
| | R2=0.185
| |
| Table 4.12: | Multiple regression analysis on the Caerphilly phase II data set for
diastolic blood pressure as dependent variable. The Gln27Glu variant was coded
as 1 (Gln27), 2 (Gln27Glu), and 3 (Glu27). Smoking was coded as 0 (never
smoking) up to 8 (25+/day). |
|
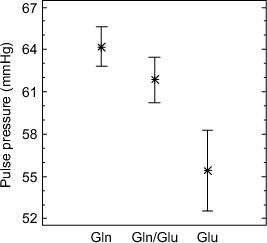
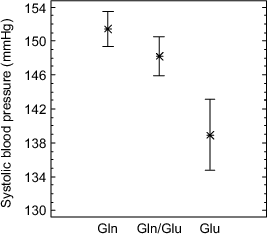
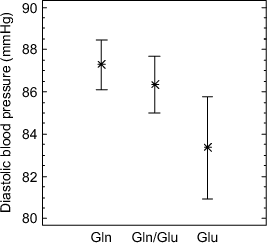
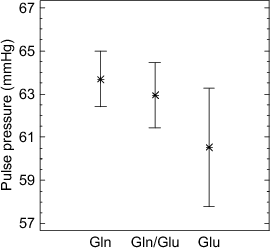
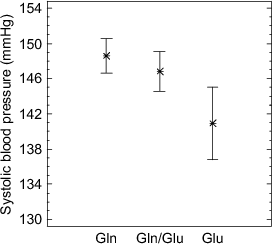
ANOVA analysis using BMI, age and alcohol consumption as covariants of phase II
data showed a significant association with systolic blood pressure (p=.0011) and pulse
pressure (p=.0007) for the Glu27Gln polymorphism (Figure 4.9). Gln27 homozygotes
showed a significantly higher systolic mean blood pressure than Glu27 homozygotes
(SBP difference = 14.6 mmHg, Table 4.15). Results for diastolic blood pressure showed
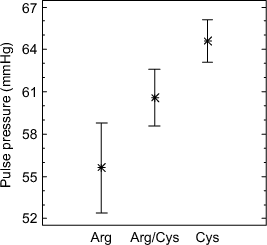
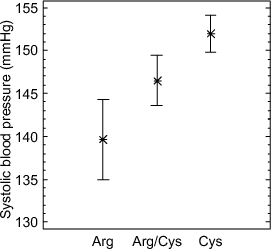
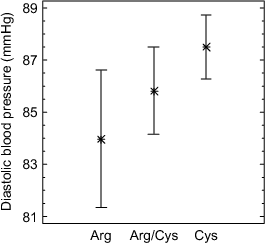
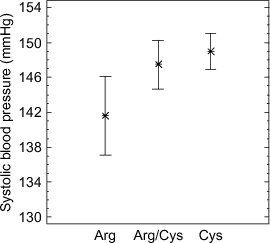
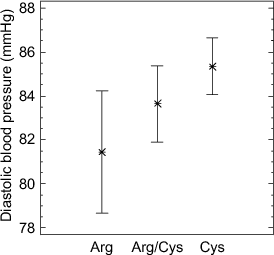
the same tendencies, but were no longer significant (p=.1269). ANOVA for the 5’ LC
polymorphism (Arg19Cys) was highly significant for pulse pressure (p=.0008) and
systolic blood pressure (p=.0018) in phase II (Figure 4.11). Mean systolic blood
pressure difference between Arg and Cys19 homozygotes was 12.3 mmHg (Table
4.18). Diastolic blood pressure showed the same trends, but was not significant
(p=.1833). Due to linkage disequilibrium the variant at position 1244 showed
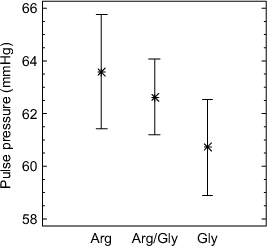
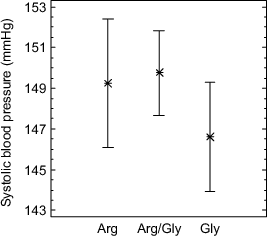
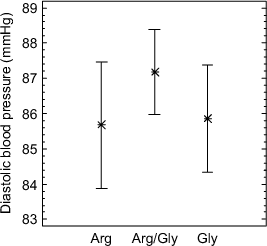
similar results. The Arg16Gly variant did not show any significant association
with diastolic, systolic or pulse pressure (Figure 4.13) in phase II or phase
III.
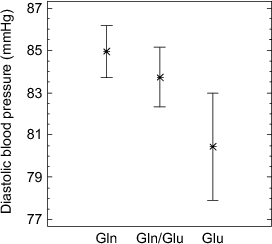
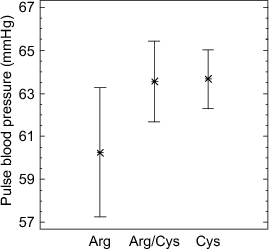
ANOVA of phase III data resulted in the same trends for the Glu27Gly
polymorphism as in phase II, but lost significance (Figure 4.10). Association with
systolic blood pressure (p=.06) and diastolic blood pressure (p=.08) were marginally
significant, pulse pressure was no longer significant (Table 4.15). Analysis of variance
of the 5’ LC Arg19Cys variant in phase III lost significance for blood pressure
completely (Figure 4.12). Multiple range tests showed a remaining significant difference
for mean systolic blood pressure in homozygotes only (Table 4.15). The method being
used to discriminate among the means is Fisher’s least significant difference (LSD, 95%
confidence intervals) procedure. Age, body mass index, alcohol consumption and
smoking habits did not exhibit any association with 5’ LC-Arg19Cys, Arg16Gly or
Glu27Gln variants.
The multivariate analyses revealed that genotype of Gln27Glu, current age, and BMI
were predictors of both systolic and diastolic blood pressure. According to
the estimation of R2 (adjusted), the Gln27Glu polymorphism could account
for 10.8% and 15.2% of variances in systolic and diastolic blood pressure,
respectively.
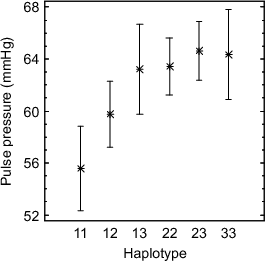
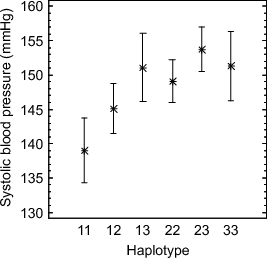
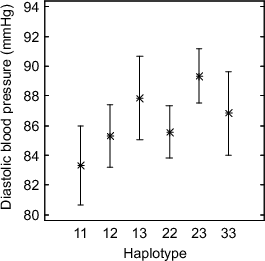
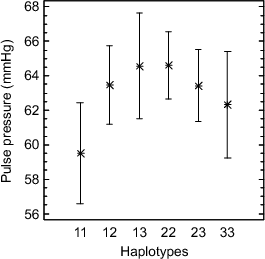
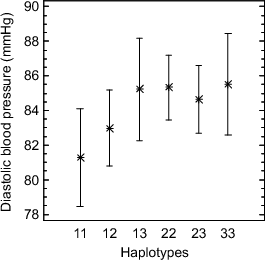
Haplotype analysis, using the 3 main haplotypes (Table 4.10), revealed significant
differences for mean systolic blood pressure (p=.0083) and pulse pressure (p=.0196) in
phase II of the Caerphilly data set (Figure 4.14). Genotype 11 (5’ LC-Arg19 Gly16
Glu27) showed the lowest mean pressure, significantly lower than combinations of the
other two 5’ LC Cys19 genotypes (Table 4.22). This effect was present in phase III data
as well, although significance was lost for systolic blood pressure and pulse pressure
(Figure 4.15).
|
|
|
|
|
| | Analysis of Variance for Systolic BP - Type III Sums of Squares
|
|
|
|
|
|
| | Source | Sum of Squares | Df | Mean Square | F-Ratio | P-Value
|
|
|
|
|
|
| | Covariates | | | | | |
| Age | 7991.05 | 1 | 7991.05 | 12.05 | 0.0005 |
| Alc. Cons. | 4911.01 | 1 | 4911.01 | 7.40 | 0.0065 |
| BMI | 31894.0 | 1 | 31894.0 | 48.09 | 0.0000 |
| Main Effects | | | | | |
| Gln27Glu | 9114.61 | 2 | 4557.31 | 6.87 | 0.0011 |
|
|
|
|
|
| | | | | | | |
|
|
|
|
|
| | Analysis of Variance for Diastolic BP - Type III Sums of Squares
|
|
|
|
|
|
| | Source | Sum of Squares | Df | Mean Square | F-Ratio | P-Value
|
|
|
|
|
|
| | Covariates | | | | | |
| Fam. His. 55 | 1130.06 | 1 | 1130.06 | 5.18 | 0.0228 |
| Smoking | 1415.78 | 1 | 1415.78 | 6.50 | 0.0108 |
| BMI | 19657.2 | 1 | 19657.2 | 90.19 | 0.0000 |
| Main Effects | | | | | |
| Gln27Glu | 902.814 | 2 | 451.407 | 2.07 | 0.1269 |
|
|
|
|
|
| | | | | | | |
|
|
|
|
|
| | Analysis of Variance for Pulse Pressure - Type III Sums of Squares
|
|
|
|
|
|
| | Source | Sum of Squares | Df | Mean Square | F-Ratio | P-Value
|
|
|
|
|
|
| | Covariates | | | | | |
| Age | 11764.8 | 1 | 11764.8 | 38.18 | 0.0000 |
| Fam. His. 55 | 1550.65 | 1 | 1550.65 | 5.03 | 0.0252 |
| Alc. Cons. | 3253.67 | 1 | 3253.67 | 10.56 | 0.0012 |
| BMI | 923.031 | 1 | 923.031 | 3.00 | 0.0840 |
| Main Effects | | | | | |
| Gln27Glu | 4573.69 | 2 | 2286.85 | 7.42 | 0.0007 |
|
|
|
|
|
| | |
| Table 4.13: | Analysis of variance for diastolic, systolic blood pressure and
pulse pressure (Type III sums of squares) for the Gln27Glu polymorphism as
independent variable of phase II of the Caerphilly data set |
|
|
|
|
|
|
| | Analysis of Variance for Systolic BP - Type III Sums of Squares
|
|
|
|
|
|
| | Source | Sum of Squares | Df | Mean Square | F-Ratio | P-Value
|
|
|
|
|
|
| | Covariates | | | | | |
| Age | 13198.5 | 1 | 13198.5 | 22.29 | 0.0000 |
| Alc. Cons. | 5895.78 | 1 | 5895.78 | 9.96 | 0.0017 |
| BMI | 31983.3 | 1 | 31983.3 | 54.02 | 0.0000 |
| Main Effects | | | | | |
| Gln27Glu | 3275.27 | 2 | 1637.64 | 2.77 | 0.0638 |
|
|
|
|
|
| | | | | | | |
|
|
|
|
|
| | Analysis of Variance for Diastolic BP - Type III Sums of Squares
|
|
|
|
|
|
| | Source | Sum of Squares | Df | Mean Square | F-Ratio | P-Value
|
|
|
|
|
|
| | Covariates | | | | | |
| Fam. His. 55 | 37.174 | 1 | 37.174 | 0.16 | 0.6863 |
| Age | 669.739 | 1 | 669.739 | 2.94 | 0.0869 |
| BMI | 14396.4 | 1 | 14396.4 | 63.23 | 0.0000 |
| Smoking | 1473.36 | 1 | 1473.36 | 6.47 | 0.0112 |
| Main Effects | | | | | |
| Gln27Glu | 1140.46 | 2 | 570.23 | 2.50 | 0.0826 |
|
|
|
|
|
| | | | | | | |
|
|
|
|
|
| | Analysis of Variance for Pulse Pressure - Type III Sums of Squares
|
|
|
|
|
|
| | Source | Sum of Squares | Df | Mean Square | F-Ratio | P-Value
|
|
|
|
|
|
| | Covariates | | | | | |
| Fam. His. 55 | 365.885 | 1 | 365.885 | 1.40 | 0.2364 |
| Age | 18087.0 | 1 | 18087.0 | 69.44 | 0.0000 |
| Alc. Cons. | 2328.83 | 1 | 2328.83 | 8.94 | 0.0029 |
| BMI | 2823.59 | 1 | 2823.59 | 10.84 | 0.0011 |
| Main Effects | | | | | |
| Gln27Glu | 556.896 | 2 | 278.448 | 1.07 | 0.3440 |
|
|
|
|
|
| | |
| Table 4.14: | Analysis of variance for diastolic, systolic blood pressure and
pulse pressure (Type III sums of squares) for the Gln27Glu polymorphism as
independent variable of phase III of the Caerphilly data set |
|
|
|
|
|
|
| | | | | Contrast
| | | Variable | | Gln27-Gln27Glu | Gln27-Glu27 | Gln27Glu-Glu27
|
|
|
|
|
|
| | | | Difference | 4.7⋆ | 14.6⋆ | 9.9⋆ |
| | Systolic blood pressure (mmHg) | ± 95% Conf. limits | 4.42 | 6.65 | 6.85 |
| | | Difference | 1.9 | 4.8⋆ | 2.9 |
| | Diastolic blood pressure (mmHg) | ± 95% Conf. limits | 2.54 | 3.82 | 3.93 |
| Phase II | | Difference | 2.8 | 9.8⋆ | 7.0⋆ |
| | Pulse pressure (mmHg) | ± 95% Conf. limits | 3.04 | 4.56 | 4.70 |
| | | Difference | 0.17 | -0.23 | -0.40 |
| | Body mass index (kg/m2)
| ± 95% Conf. limits | 0.663 | 0.996 | 1.026 |
|
|
|
|
|
| | | | Difference | 2.1 | 7.9⋆ | 5.7 |
| | Systolic blood pressure (mmHg) | ± 95% Conf. limits | 4.27 | 6.42 | 6.63 |
| | | Difference | 1.0 | 4.2⋆ | 3.2 |
| Phase III | Diastolic blood pressure (mmHg) | ± 95% Conf. limits | 2.64 | 3.98 | 4.10 |
| | | Difference | 1.1 | 3.6 | 2.5 |
| | Pulse pressure (mmHg) | ± 95% Conf. limits | 2.84 | 4.28 | 4.42 |
|
|
|
|
|
| | ⋆ denotes a statistically significant difference.
| | |
| Table 4.15: | Multiple range tests for the Gln27Glu mutation of phase II and III of
the Caerphilly set, showing the estimated difference between each pair of means
(Method: 95.0 percent LSD) |
|
|
|
|
|
|
| | Analysis of Variance for Systolic BP - Type III Sums of Squares
|
|
|
|
|
|
| | Source | Sum of Squares | Df | Mean Square | F-Ratio | P-Value
|
|
|
|
|
|
| | Covariates | | | | | |
| BMI | 20424.8 | 1 | 20424.8 | 30.64 | 0.0000 |
| Age | 4601.69 | 1 | 4601.69 | 6.90 | 0.0089 |
| Alc. Cons. | 3604.09 | 1 | 3604.09 | 5.41 | 0.0205 |
| Main Effects | | | | | |
| 5’ LC Arg19Cys | 8522.43 | 2 | 4261.22 | 6.39 | 0.0018 |
|
|
|
|
|
| | | | | | | |
|
|
|
|
|
| | Analysis of Variance for Diastolic BP - Type III Sums of Squares
|
|
|
|
|
|
| | Source | Sum of Squares | Df | Mean Square | F-Ratio | P-Value
|
|
|
|
|
|
| | Covariates | | | | | |
| BMI | 12807.8 | 1 | 12807.8 | 59.81 | 0.0000 |
| Age | 519.142 | 1 | 519.142 | 2.42 | 0.1201 |
| Fam. His. 55 | 1189.79 | 1 | 1189.79 | 5.56 | 0.0188 |
| Smoking | 1169.46 | 1 | 1169.46 | 5.46 | 0.0199 |
| Main Effects | | | | | |
| 5’ LC Arg19Cys | 713.944 | 2 | 356.972 | 1.67 | 0.1899 |
|
|
|
|
|
| | | | | | | |
|
|
|
|
|
| | Analysis of Variance for Pulse Pressure - Type III Sums of Squares
|
|
|
|
|
|
| | Source | Sum of Squares | Df | Mean Square | F-Ratio | P-Value
|
|
|
|
|
|
| | Covariates | | | | | |
| Fam. His. 55 | 2149.49 | 1 | 2149.49 | 6.84 | 0.0092 |
| BMI | 492.516 | 1 | 492.516 | 1.57 | 0.2111 |
| Age | 7313.19 | 1 | 7313.19 | 23.28 | 0.0000 |
| Alc. Cons. | 1352.28 | 1 | 1352.28 | 4.31 | 0.0385 |
| Main Effects | | | | | |
| 5’ LC Arg19Cys | 4565.17 | 2 | 2282.58 | 7.27 | 0.0008 |
|
|
|
|
|
| | |
| Table 4.16: | Analysis of variance for diastolic, systolic blood pressure and pulse
pressure (Type III sums of squares) for the 5’ LC Arg19Cys polymorphism as
independent variable of phase II of the Caerphilly data set |
|
|
|
|
|
|
| | Analysis of Variance for Systolic BP - Type III Sums of Squares
|
|
|
|
|
|
| | Source | Sum of Squares | Df | Mean Square | F-Ratio | P-Value
|
|
|
|
|
|
| | Covariates | | | | | |
| Alc. Cons. | 5668.87 | 1 | 5668.87 | 9.57 | 0.0021 |
| Age | 7527.91 | 1 | 7527.91 | 12.70 | 0.0004 |
| BMI | 23770.2 | 1 | 23770.2 | 40.12 | 0.0000 |
| Main Effects | | | | | |
| 5’ LC Arg19Cys | 2500.22 | 2 | 1250.11 | 2.11 | 0.1224 |
|
|
|
|
|
| | | | | | | |
|
|
|
|
|
| | Analysis of Variance for Diastolic BP - Type III Sums of Squares
|
|
|
|
|
|
| | Source | Sum of Squares | Df | Mean Square | F-Ratio | P-Value
|
|
|
|
|
|
| | Covariates | | | | | |
| Smoking | 1676.22 | 1 | 1676.22 | 7.33 | 0.0070 |
| Age | 841.026 | 1 | 841.026 | 3.68 | 0.0557 |
| BMI | 9156.31 | 1 | 9156.31 | 40.06 | 0.0000 |
| Main Effects | | | | | |
| 5’ LC Arg19Cys | 815.294 | 2 | 407.647 | 1.78 | 0.1692 |
|
|
|
|
|
| | | | | | | |
|
|
|
|
|
| | Analysis of Variance for Pulse Pressure - Type III Sums of Squares
|
|
|
|
|
|
| | Source | Sum of Squares | Df | Mean Square | F-Ratio | P-Value
|
|
|
|
|
|
| | Covariates | | | | | |
| Alc. Cons. | 2495.33 | 1 | 2495.33 | 9.51 | 0.0022 |
| Age | 12036.8 | 1 | 12036.8 | 45.88 | 0.0000 |
| BMI | 2784.36 | 1 | 2784.36 | 10.61 | 0.0012 |
| Main Effects | | | | | |
| 5’ LC Arg19Cys | 555.927 | 2 | 277.963 | 1.06 | 0.3475 |
|
|
|
|
|
| | |
| Table 4.17: | Analysis of variance for diastolic, systolic blood pressure and pulse
pressure (Type III sums of squares) for the 5’ LC Arg19Cys polymorphism as
independent variable of phase III of the Caerphilly data set |
|
|
|
|
|
|
| | | | | Contrast
| | | Variable | | Arg19-Arg19Cys | Arg19-Cys19 | Arg19Cys-Cys19
|
|
|
|
|
|
| | | | Difference | -6.9 | -12.3⋆ | -5.5⋆ |
| | Systolic blood pressure (mmHg) | ± 95% Conf. limits | 7.75 | 7.24 | 5.16 |
| | | Difference | -1.8 | -3.5 | -1.7 |
| | Diastolic blood pressure (mmHg) | ± 95% Conf. limits | 4.39 | 4.10 | 2.92 |
| Phase II | | Difference | -5.0 | -9.0⋆ | -4.0⋆ |
| | Pulse pressure (mmHg) | ± 95% Conf. limits | 5.32 | 4.97 | 3.54 |
| | | Difference | 0.25 | 0.23 | -0.02 |
| | Body mass index (kg/m2)
| ± 95% Conf. limits | 1.132 | 1.056 | 0.753 |
|
|
|
|
|
| | | | Difference | -5.9 | -7.4⋆ | -1.5 |
| | Systolic blood pressure (mmHg) | ± 95% Conf. limits | 7.52 | 7.03 | 4.93 |
| | | Difference | -2.2 | -3.9 | -1.7 |
| Phase III | Diastolic blood pressure (mmHg) | ± 95% Conf. limits | 4.64 | 4.33 | 3.06 |
| | | Difference | -3.3 | -3.4 | -0.1 |
| | Pulse pressure (mmHg) | ± 95% Conf. limits | 5.00 | 4.68 | 3.28 |
|
|
|
|
|
| | ⋆ denotes a statistically significant difference.
| | |
| Table 4.18: | Multiple range tests for the 5’ LC Arg19Cys mutation of phase II
and III of the Caerphilly set, showing the estimated difference between each pair
of means (Method: 95.0 percent LSD) |
|
|
|
|
|
|
| | Analysis of Variance for Systolic BP - Type III Sums of Squares
|
|
|
|
|
|
| | Source | Sum of Squares | Df | Mean Square | F-Ratio | P-Value
|
|
|
|
|
|
| | Covariates | | | | | |
| BMI | 31215.2 | 1 | 31215.2 | 46.14 | 0.0000 |
| Age | 7978.61 | 1 | 7978.61 | 11.79 | 0.0006 |
| Alc. Cons. | 4798.12 | 1 | 4798.12 | 7.09 | 0.0077 |
| Main Effects | | | | | |
| Arg16Gly | 1167.1 | 2 | 583.55 | 0.86 | 0.4226 |
|
|
|
|
|
| | | | | | | |
|
|
|
|
|
| | Analysis of Variance for Diastolic BP - Type III Sums of Squares
|
|
|
|
|
|
| | Source | Sum of Squares | Df | Mean Square | F-Ratio | P-Value
|
|
|
|
|
|
| | Covariates | | | | | |
| BMI | 19339.7 | 1 | 19339.7 | 88.52 | 0.0000 |
| Age | 485.486 | 1 | 485.486 | 2.22 | 0.1360 |
| Fam. His. 55 | 995.876 | 1 | 995.876 | 4.56 | 0.0328 |
| Smoking | 1405.06 | 1 | 1405.06 | 6.43 | 0.0112 |
| Main Effects | | | | | |
| Arg16Gly | 297.502 | 2 | 148.751 | 0.68 | 0.5066 |
|
|
|
|
|
| | | | | | | |
|
|
|
|
|
| | Analysis of Variance for Pulse Pressure - Type III Sums of Squares
|
|
|
|
|
|
| | Source | Sum of Squares | Df | Mean Square | F-Ratio | P-Value
|
|
|
|
|
|
| | Covariates | | | | | |
| BMI | 863.187 | 1 | 863.187 | 2.74 | 0.0982 |
| Age | 11686.1 | 1 | 11686.1 | 37.15 | 0.0000 |
| Fam. His. 55 | 1595.62 | 1 | 1595.62 | 5.07 | 0.0247 |
| Alc. Cons. | 3139.93 | 1 | 3139.93 | 9.98 | 0.0017 |
| Main Effects | | | | | |
| Arg16Gly | 695.052 | 2 | 347.526 | 1.10 | 0.3320 |
|
|
|
|
|
| | |
| Table 4.19: | Analysis of variance for diastolic, systolic blood pressure and
pulse pressure (Type III sums of squares) for the Arg16Gly polymorphism as
independent variable of phase II of the Caerphilly data set |
|
|
|
|
|
|
| | Analysis of Variance for Systolic BP - Type III Sums of Squares
|
|
|
|
|
|
| | Source | Sum of Squares | Df | Mean Square | F-Ratio | P-Value
|
|
|
|
|
|
| | Covariates | | | | | |
| Age | 6750.15 | 1 | 6750.15 | 10.27 | 0.0014 |
| Alc. Cons. | 7667.17 | 1 | 7667.17 | 11.66 | 0.0007 |
| BMI | 24303.5 | 1 | 24303.5 | 36.96 | 0.0000 |
| Main Effects | | | | | |
| Haplotypes | 10336.4 | 5 | 2067.28 | 3.14 | 0.0083 |
|
|
|
|
|
| | | | | | | |
|
|
|
|
|
| | Analysis of Variance for Diastolic BP - Type III Sums of Squares
|
|
|
|
|
|
| | Source | Sum of Squares | Df | Mean Square | F-Ratio | P-Value
|
|
|
|
|
|
| | Covariates | | | | | |
| Alc. Cons. | 1371.28 | 1 | 1371.28 | 6.56 | 0.0108 |
| Fam. His. 55 | 1058.02 | 1 | 1058.02 | 5.06 | 0.0250 |
| Smoking | 1469.52 | 1 | 1469.52 | 7.02 | 0.0083 |
| BMI | 13849.5 | 1 | 13849.5 | 66.20 | 0.0000 |
| Main Effects | | | | | |
| Haplotypes | 1906.38 | 5 | 381.276 | 1.82 | 0.1068 |
|
|
|
|
|
| | | | | | | |
|
|
|
|
|
| | Analysis of Variance for Pulse Pressure - Type III Sums of Squares
|
|
|
|
|
|
| | Source | Sum of Squares | Df | Mean Square | F-Ratio | P-Value
|
|
|
|
|
|
| | Covariates | | | | | |
| Age | 9351.69 | 1 | 9351.69 | 29.46 | 0.0000 |
| Alc. Cons. | 3175.32 | 1 | 3175.32 | 10.00 | 0.0017 |
| Fam. His. 55 | 2237.68 | 1 | 2237.68 | 7.05 | 0.0082 |
| BMI | 892.881 | 1 | 892.881 | 2.81 | 0.0941 |
| Main Effects | | | | | |
| Haplotypes | 4312.7 | 5 | 862.541 | 2.72 | 0.0196 |
|
|
|
|
|
| | |
| Table 4.20: | Analysis of variance for diastolic, systolic blood pressure and pulse
pressure (Type III sums of squares) for genotypes of the β2 adrenoceptor as
independent variable of phase II of the Caerphilly data set |
|
|
|
|
|
|
| | Analysis of Variance for Systolic BP - Type III Sums of Squares
|
|
|
|
|
|
| | Source | Sum of Squares | Df | Mean Square | F-Ratio | P-Value
|
|
|
|
|
|
| | Covariates | | | | | |
| Age | 9377.8 | 1 | 9377.8 | 15.66 | 0.0001 |
| Alc. Cons. | 6891.22 | 1 | 6891.22 | 11.50 | 0.0008 |
| BMI | 27242.1 | 1 | 27242.1 | 45.48 | 0.0000 |
| Main Effects | | | | | |
| Haplotypes | 3168.01 | 5 | 633.603 | 1.06 | 0.3831 |
|
|
|
|
|
| | | | | | | |
|
|
|
|
|
| | Analysis of Variance for Diastolic BP - Type III Sums of Squares
|
|
|
|
|
|
| | Source | Sum of Squares | Df | Mean Square | F-Ratio | P-Value
|
|
|
|
|
|
| | Covariates | | | | | |
| Age | 545.42 | 1 | 545.42 | 2.38 | 0.1238 |
| Smoking | 1771.89 | 1 | 1771.89 | 7.72 | 0.0057 |
| Alc. Cons. | 1482.95 | 1 | 1482.95 | 6.46 | 0.0113 |
| BMI | 10141.8 | 1 | 10141.8 | 44.18 | 0.0000 |
| Main Effects | | | | | |
| Haplotypes | 935.189 | 5 | 187.038 | 0.81 | 0.5394 |
|
|
|
|
|
| | | | | | | |
|
|
|
|
|
| | Analysis of Variance for Pulse Pressure - Type III Sums of Squares
|
|
|
|
|
|
| | Source | Sum of Squares | Df | Mean Square | F-Ratio | P-Value
|
|
|
|
|
|
| | Covariates | | | | | |
| Blood glucose | 1696.06 | 1 | 1696.06 | 6.87 | 0.0091 |
| Age | 12245.8 | 1 | 12245.8 | 49.60 | 0.0000 |
| Alc. Cons. | 3239.62 | 1 | 3239.62 | 13.12 | 0.0003 |
| BMI | 1761.56 | 1 | 1761.56 | 7.13 | 0.0078 |
| Main Effects | | | | | |
| Haplotypes | 1059.5 | 5 | 211.899 | 0.86 | 0.5091 |
|
|
|
|
|
| | |
| Table 4.21: | Analysis of variance for diastolic, systolic blood pressure and pulse
pressure (Type III sums of squares) for genotypes of the β2 adrenoceptor as
independent variable of phase III of the Caerphilly data set |
|
|
|
|
|
| | Least Squares Means for Diastolic Blood Pressure (mmHg)
|
|
|
|
|
| | Haplotype | Mean | Std. Error | Lower Limit | Upper Limit
|
|
|
|
|
| | 11 | 83.31 | 1.90 | 79.58 | 87.04 |
| 12 | 85.29 | 1.50 | 82.34 | 88.24 |
| 13 | 87.85 | 2.02 | 83.89 | 91.82 |
| 22 | 85.56 | 1.27 | 83.07 | 88.05 |
| 23 | 89.34 | 1.31 | 86.76 | 91.92 |
| 33 | 86.83 | 2.03 | 82.84 | 90.81 |
|
|
|
|
| | | | | | |
|
|
|
|
| | Least Squares Means for Systolic Blood Pressure (mmHg)
|
|
|
|
|
| | Haplotype | Mean | Std. Error | Lower Limit | Upper Limit
|
|
|
|
|
| | 11 | 139.01 | 3.37 | 132.39 | 145.63 |
| 12 | 145.13 | 2.67 | 139.90 | 150.36 |
| 13 | 151.08 | 3.56 | 144.08 | 158.08 |
| 22 | 149.07 | 2.24 | 144.67 | 153.48 |
| 23 | 153.71 | 2.33 | 149.14 | 158.28 |
| 33 | 151.32 | 3.60 | 144.25 | 158.39 |
|
|
|
|
| | | | | | |
|
|
|
|
| | Least Squares Means for Pulse Pressure (mmHg)
|
|
|
|
|
| | Haplotype | Mean | Std. Error | Lower Limit | Upper Limit
|
|
|
|
|
| | 11 | 55.58 | 2.34 | 50.98 | 60.18 |
| 12 | 59.75 | 1.85 | 56.11 | 63.38 |
| 13 | 63.23 | 2.48 | 58.35 | 68.11 |
| 22 | 63.43 | 1.56 | 60.36 | 66.49 |
| 23 | 64.65 | 1.62 | 61.47 | 67.83 |
| 33 | 64.34 | 2.50 | 59.42 | 69.26 |
|
|
|
|
| | |
| Table 4.22: | Least squares means for diastolic, systolic blood pressure and
pulse pressure of different β2 adrenoceptor genotypes with 95.0% conf.
intervals. (Haplotype 1: 5’ LC-Arg19/1242C/Gly16/Glu27, haplotype 2: 5’
LC-Cys19/1242T/Arg16/Gln27, haplotype 3: 5’ LC-Cys19/1242T/Gly16/Gln27) |
|
|
|
|
|
|
|
| | Variable | Gln27 | Gln27Glu | Glu27
|
|
|
|
|
|
|
| | Count (n) | 311 | 236 | 72
| | Age (y) | 56.91± | 4.49 | 56.93± | 4.48 | 57.0± | 4.64 |
| Systolic blood pressure (mmHg) | 151.4± | 28.1 | 147.6± | 27.0 | 139.5± | 22.0 |
| Diastolic blood pressure (mmHg) | 87.2± | 15.5 | 86.1± | 16.7 | 83.9± | 15.9 |
| Pulse pressure (mmHg) | 64.2± | 19.6 | 61.5± | 17.0 | 55.6± | 15.4 |
| Body mass index (kg/m2) | 26.51± | 3.95 | 26.34± | 3.59 | 26.74± | 4.42 |
|
|
|
|
|
|
| | |
| Table 4.23: | Statistics summary for the Glu27Gln variants of Caerphilly phase II,
expressed as mean ± SD |
|
|
|
|
|
|
|
| | Variable | Arg16 | Arg16Gly | Gly16
|
|
|
|
|
|
|
| | Count (n) | 132 | 303 | 184
| | Age (y) | 56.97± | 4.58 | 56.77± | 4.40 | 57.16± | 4.60 |
| Systolic blood pressure (mmHg) | 149.1± | 27.8 | 149.6± | 27.1 | 146.5± | 27.0 |
| Diastolic blood pressure (mmHg) | 85.3± | 15.4 | 87.3± | 16.3 | 85.7± | 16.1 |
| Pulse pressure (mmHg) | 62.3± | 18.0 | 61.5± | 17.0 | 60.8± | 18.3 |
| Body mass index (kg/m2) | 26.31± | 3.89 | 26.58± | 3.86 | 26.42± | 4.60 |
|
|
|
|
|
|
| | |
| Table 4.24: | Statistics summary for the Arg16Gly variants of Caerphilly phase II,
expressed as mean ± SD |
|
|
|
|
|
|
|
| | Variable | 1244C | C1244T | 1244T
|
|
|
|
|
|
|
| | Count (n) | 61 | 153 | 277
| | Age (y) | 56.92± | 4.85 | 56.57± | 4.41 | 56.84± | 4.51 |
| Systolic blood pressure (mmHg) | 140.7± | 22.2 | 145.7± | 26.4 | 151.8± | 28.0 |
| Diastolic blood pressure (mmHg) | 84.6± | 16.3 | 85.8± | 16.0 | 87.2± | 15.5 |
| Pulse pressure (mmHg) | 56.2± | 15.8 | 59.9± | 16.7 | 64.6± | 19.5 |
| Body mass index (kg/m2) | 26.67± | 4.62 | 26.39± | 3.33 | 26.38± | 3.79 |
|
|
|
|
|
|
| | |
| Table 4.25: | Statistics summary for the C1244T variants of Caerphilly phase II,
expressed as mean ± SD |
|
|
|
|
|
|
|
| | Variable | Arg19 | Arg19Cys | Cys19
|
|
|
|
|
|
|
| | Count (n) | 60 | 154 | 277
| | Age (y) | 57.03± | 4.81 | 56.59± | 4.40 | 56.81± | 4.53 |
| Systolic blood pressure (mmHg) | 140.3± | 22.1 | 145.8± | 26.4 | 151.9± | 28.0 |
| Diastolic blood pressure (mmHg) | 84.2± | 16.2 | 85.9± | 16.0 | 87.3± | 15.6 |
| Pulse pressure (mmHg) | 56.1± | 15.9 | 60.0± | 16.6 | 64.6± | 19.5 |
| Body mass index (kg/m2) | 26.63± | 4.65 | 26.38± | 3.32 | 26.40± | 3.79 |
|
|
|
|
|
|
| | |
| Table 4.26: | Statistics summary for the Arg19Cys variants of Caerphilly phase II,
expressed as mean ± SD |
|
© 2001 Alexander Binder